Whether it’s on social media, on the app stores, through emails or phone calls, we receive hundreds of messages from our users every day, and answer each of them.
If answering questions is good, fixing the original problem is even better. We truly believe in this virtuous circle as a customer centric company.
Since customer service data is the first accessible and actionable “member voice” data in every company, we started by focusing on it. In collaboration between product, customer relationship & data, we wanted to turn our volumes of tickets & phone calls into clear contact reasons, to identify pain points on which we should focus to improve user experience.
Here are the steps we used at Drivy to improve the way we deal with member voice. This is not a perfect process and might not work for you as it is, but we’ve been successful with this approach.
The very first step is to make a list of all the possible issues you can think of (replicating the customer journey helps), and gather it behind topics. If a topic seems too big, split it into smaller topics. Accept you won’t be able to be exhaustive, but don’t end up in a giant “Other” section. Turn these topics into tags to apply it on tickets or phone calls.
After checking with the Customer Service team that the tags made sense, we applied them on each ticket and phone call manually until we had enough data to run our analysis. Onboarding of front-line teams is key for the quality of the data as their input is the basis of our analysis.
We could then identify the contact reasons in each country ranked by volume, and understand clearly what pain points generated most contacts from our users.
Manual tagging can’t scale, and doesn’t enable us to know in advance why a user needs our help.
In order to achieve that, we revamped our contact form to reflect the contact reasons we observed from our manual test. This way, according to the contact reason the user selected, we could either push help articles, or let him contact us and prioritize his request.
In order to perform our analysis, we needed to have access to the necessary data from our ticketing, phone calls and satisfaction tools.
We imported the data in Redshift thanks to an Extract Load and Transform process using Apache Airflow and some Python scripts. The tables are updated on a regular basis.
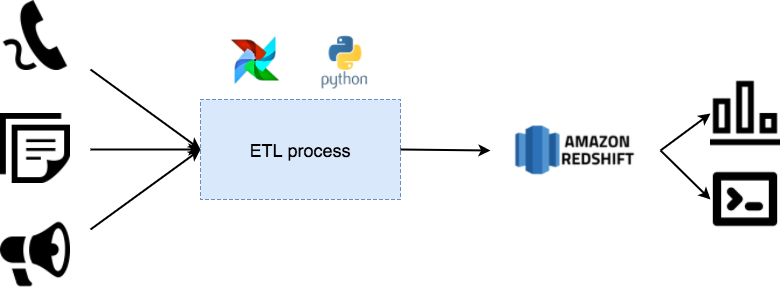
Once the data was available in Redshift, we wanted to know what were the issues faced by our users in each country at a glance, so anyone in the company could know it, without requiring to be a SQL expert.
We created dashboards on Redash displaying the data we needed to understand our users better.
However, it’s not all about volumes. A topic generating lots of contact is not necessarily the top source of insatisfaction. We also implemented satisfaction surveys sent automatically after each ticket resolution. This way, we can identify easily which contact reasons generate insatisfaction, and work on improving our treatment processes and policies.
It’s the mix volume x insatisfaction that truly tells us where our focus should be.
When focusing on a major pain point, we needed to understand precisely what were the issues faced by our users. We are frequently spending time reading the tickets and listening to phone calls so that we can capture better our users perception and feelings, as well as precise the pain points we need to work on with product evolution.
We started with the data from our customer service, but there are lots of other sources we’d love to include (app reviews, social media posts…).
Including these other sources will help us catch more than only pain points. Feedbacks on the product help us not only on reducing insatisfaction, but increase satisfaction and user delight.